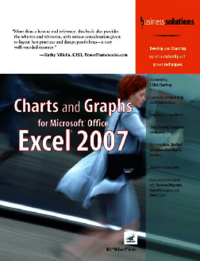
Charts and Graphs for Microsoft Office Excel 2007
Charts and Graphs for Microsoft Office Excel 2007
113 Visitas | 121 Descargas | 2015-12-18 14:40:41 | pecarrazana
Descripción
The goal of this book is to make you more efficient and effective in creating visual displays of information using Excel. In the early chapters of this book, you will learn how to use the new Excel 2007 charting interface. Chapters 3 through 6 walk you through all the built-in chart types and talk about when you can use each chart type. Chapter 7 discusses about creating unusual charts. Chapter 8 covers pivot charts, and Chapter 9 covers creating visual displays of information right in the worksheet. Chapter 10 covers mapping, and Chapter 11 covers the new SmartArt business graphics, as well as Excel 2007’s shape tools. The penultimate chapter presents macro tools you can use to automate the production of charts using Excel VBA. In Chapter 14, you will see several techniques that people may use to stretch the truth with charts. Finally, in Appendix A, I provide you with a list of resources to give you additional help with creating charts and graphs.
Detalles
| Autor(es): |
|
| Año: | 2007 |
| Páginas: | 477 |
| Lenguaje: | Inglés |
| Tamaño: | 19.78 MB |
| Categoría: | Microsoft Office |
| Etiquetas: | Excel office |
Otros Libros de "Microsoft Office"
Contribuir
Usted puede contribuir con Libros UCLV, es importante para nosotros su aporte..
Contribuir


